
Reduced volatility and a resilient market in the first quarter 2023. The S&P500 was up about 7.5% while, with rotation back to growth versus value, the Nasdaq 100 was up about 21%. A bit of relief following a tumultuous 2022. Let us start with some statistics; they may provide some insight as to where we go from here.
- The S&P 500’s 7.5% rally in Q1 2023 was the second straight quarter of 5%+ gains. Since WWII, there have been 25 prior back-to-back quarterly gains of 5%+ for the S&P 500. Over the next two quarters, the index’s median gain was 8.2% with positive returns 23 times. (SOURCE: BESPOKE)
- Since WWII, when the S&P 500 has posted a gain in Q1, it has averaged a rest-of-year gain of 8.9%. When the S&P 500 has been down in Q1, the rest of-year gain has only been 2.6%. In the ten years that the Q1 gain followed a down year, the average rest-of-year gain was 15.9% with positive returns every time. (SOURCE: BESPOKE)
As you can see, the average return the balance of the year was nearly twice as much when the first quarter gain followed a down year.
The market held up well despite the signs that the Fed raising interest so quickly may have finally broken something. The banking crisis began with the insolvency of Silicon Valley Bank and Signature Bank to follow, which brought back memories of 2008 when the financial crisis roiled markets. We believe these turned out to be problems specific to these banks and so far, no contagion. The Government quickly back stopped the FDIC deposit concerns. As we mentioned in our video commentary about the banking crisis, the same issues do not exist that caused the financial crisis in 2008. At that time, banks reserves where invested heavily in derivative products that seized up to the point that their value could not even be easily determined. Today, bank reserves are strong and generally there is little credit risk. However, with interest rates rising quickly, some banks have a mismatch in terms of shorter term deposit rates they need to pay, versus longer term reserves. Though longer term Treasury Bonds do not have credit risk, they do go down in value with rising interest rates if a bank had to sell them to meet liquidity issues. Silicon Valley Bank for example, had to sell bonds at a loss in order to try to meet liquidity needs as deposits were withdrawn.
Since we referred to the 2008 financial crisis, let’s look at some statistics that prove it is “not timing the market, but time in the market.”
- From the pre-Financial Crisis high on 10/9/07, the S&P 500’s annualized return of 8.4% is barely half the gain seen since the Financial Crisis lows. Despite the difference, 8.4% is still more than three percentage points higher than any point on the US Treasury yield curve as of 3/9/2023. (SOURCE: BLOOMBERG)
If a very unlucky investor bought at the absolute high before the 2008 financial crisis, and had the ability to think longer term and stay invested, the S&P 500 would have still averaged 8.4% through 3/9/23, handily beating a bond portfolio. If an investor was extremely lucky, the S&P 500 averaged an annualized gain of about 15.8% if it was bought at the 3/9/2009 low.
We have said before that the market goes up about 80% of the time, but sometimes we forget this means that it goes down 20% of the time. Though the last fifteen months have not been fun, we applaud your patience and believe, as history shows, your patience will be rewarded. In fact, as we believe the Fed interest rate hiking cycle is near the end, here is another related stat.
- Last 7 times, when the Fed stopped raising rates, the market was up an average of 12% a year later. (SOURCE: CNBC Commentary)
We have also recently witnessed what some call a “buying thrust”, which is when over 90% of stocks are trading at a price above their 10-day average.
- Recently 93% of stocks were above their 10-day moving average. Some call this a “buying thrust”. 1 year later the market was up 23 out of 24 times this happened and up an average of 18.5%. (SOURCE: CNBC Commentary)
While we cannot predict actual returns over the next year, we are seeing some positive signs.
Inflation: The month over month March Consumer Price Index (CPI) was expected at 0.2% but came in at half that level at 0.1%. The year over year CPI was expected 5.1% but was 5%. What we believe is more important is that the February CPI was 6% and March was 5% meaning a full 1% drop.
Inflation at the producer level, the Producer Price Index (PPI) was expected to show a month over month increase of 0.1% but was actually -0.5% when released. This is two month over month contractions in a row. The year over year showed annual PPI only increasing at a rate of 2.79%.
The next Federal Open Market Committee (FOMC) meeting starts May 2nd, and on May 3rd, they will announce any rate change. The market expects either a pause, or more likely, another 0.25% (25 basis point) hike. Even if there is another hike, most believe the Fed will pause and potentially end the interest rate tightening cycle. Any pause or more dovish commentary would likely be taken as a positive by the market though it is always a volatile day.
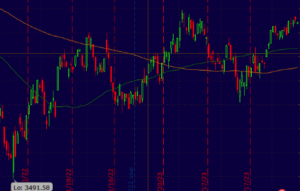
As the picture below illustrates, technically the market looks better. Since the October lows, the chart for the S&P 500 has established a series of higher highs and higher lows. This has created a trading range that is ascending. As of this writing, the Nasdaq has already established a higher high in the current chart pattern and the S&P 500 is attempting to make a higher high now.
Another positive sign is that investors have rotated back to growth and away from the more defensive areas of value. This was shown above by the extreme outperformance of the Nasdaq versus the S&P 500 in the first quarter.
Recession or not?
The fear of higher interest rates has been replaced by the fear that the economy will not be able to survive the higher rate environment and end up in recession. From the beginning of this bear market, we have said that the bear market started from a place where the economy and employment was very strong. This created a substantial cushion for any growth slowdown caused by the new interest rate environment. One key will be corporate earnings, estimates have been reduced, but that market always over does it. Likely earnings will come in better than expected and begin to relieve recession concerns. The recent decline in the Dollar Index will also help the earnings of America’s large multi-national companies.
The market is a leading indicator. It looks forward and will likely start to price in the expectation of recovery even before it occurs. This is why valuations typically improve even when it looks like we may not be out of the woods yet. We do expect the potential for more volatility, and there is a chance we try to go down one more time. That said, it would likely be viewed as opportunity as the market looks beyond the current environment to renewed economic growth, and the potential for stable if not falling interest rates as the economy has slowed.
The average bear market lasts 1.2 years and that is about where we are now. Continue to look beyond the current environment, and as the historical statistics outlined above show, we believe better times for the market are near.
We will put out additional commentary as needed, and as always, we thank you for your trust and confidence.
Royal Fund Management
April 13th, 2023 Quarterly Market Commentary – Royal Fund Management
Published by Gabe Fransen on
Reduced volatility and a resilient market in the first quarter 2023. The S&P500 was up about 7.5% while, with rotation back to growth versus value, the Nasdaq 100 was up about 21%. A bit of relief following a tumultuous 2022. Let us start with some statistics; they may provide some insight as to where we go from here.
As you can see, the average return the balance of the year was nearly twice as much when the first quarter gain followed a down year.
The market held up well despite the signs that the Fed raising interest so quickly may have finally broken something. The banking crisis began with the insolvency of Silicon Valley Bank and Signature Bank to follow, which brought back memories of 2008 when the financial crisis roiled markets. We believe these turned out to be problems specific to these banks and so far, no contagion. The Government quickly back stopped the FDIC deposit concerns. As we mentioned in our video commentary about the banking crisis, the same issues do not exist that caused the financial crisis in 2008. At that time, banks reserves where invested heavily in derivative products that seized up to the point that their value could not even be easily determined. Today, bank reserves are strong and generally there is little credit risk. However, with interest rates rising quickly, some banks have a mismatch in terms of shorter term deposit rates they need to pay, versus longer term reserves. Though longer term Treasury Bonds do not have credit risk, they do go down in value with rising interest rates if a bank had to sell them to meet liquidity issues. Silicon Valley Bank for example, had to sell bonds at a loss in order to try to meet liquidity needs as deposits were withdrawn.
Since we referred to the 2008 financial crisis, let’s look at some statistics that prove it is “not timing the market, but time in the market.”
If a very unlucky investor bought at the absolute high before the 2008 financial crisis, and had the ability to think longer term and stay invested, the S&P 500 would have still averaged 8.4% through 3/9/23, handily beating a bond portfolio. If an investor was extremely lucky, the S&P 500 averaged an annualized gain of about 15.8% if it was bought at the 3/9/2009 low.
We have said before that the market goes up about 80% of the time, but sometimes we forget this means that it goes down 20% of the time. Though the last fifteen months have not been fun, we applaud your patience and believe, as history shows, your patience will be rewarded. In fact, as we believe the Fed interest rate hiking cycle is near the end, here is another related stat.
We have also recently witnessed what some call a “buying thrust”, which is when over 90% of stocks are trading at a price above their 10-day average.
While we cannot predict actual returns over the next year, we are seeing some positive signs.
Inflation: The month over month March Consumer Price Index (CPI) was expected at 0.2% but came in at half that level at 0.1%. The year over year CPI was expected 5.1% but was 5%. What we believe is more important is that the February CPI was 6% and March was 5% meaning a full 1% drop.
Inflation at the producer level, the Producer Price Index (PPI) was expected to show a month over month increase of 0.1% but was actually -0.5% when released. This is two month over month contractions in a row. The year over year showed annual PPI only increasing at a rate of 2.79%.
The next Federal Open Market Committee (FOMC) meeting starts May 2nd, and on May 3rd, they will announce any rate change. The market expects either a pause, or more likely, another 0.25% (25 basis point) hike. Even if there is another hike, most believe the Fed will pause and potentially end the interest rate tightening cycle. Any pause or more dovish commentary would likely be taken as a positive by the market though it is always a volatile day.
As the picture below illustrates, technically the market looks better. Since the October lows, the chart for the S&P 500 has established a series of higher highs and higher lows. This has created a trading range that is ascending. As of this writing, the Nasdaq has already established a higher high in the current chart pattern and the S&P 500 is attempting to make a higher high now.
Another positive sign is that investors have rotated back to growth and away from the more defensive areas of value. This was shown above by the extreme outperformance of the Nasdaq versus the S&P 500 in the first quarter.
Recession or not?
The fear of higher interest rates has been replaced by the fear that the economy will not be able to survive the higher rate environment and end up in recession. From the beginning of this bear market, we have said that the bear market started from a place where the economy and employment was very strong. This created a substantial cushion for any growth slowdown caused by the new interest rate environment. One key will be corporate earnings, estimates have been reduced, but that market always over does it. Likely earnings will come in better than expected and begin to relieve recession concerns. The recent decline in the Dollar Index will also help the earnings of America’s large multi-national companies.
The market is a leading indicator. It looks forward and will likely start to price in the expectation of recovery even before it occurs. This is why valuations typically improve even when it looks like we may not be out of the woods yet. We do expect the potential for more volatility, and there is a chance we try to go down one more time. That said, it would likely be viewed as opportunity as the market looks beyond the current environment to renewed economic growth, and the potential for stable if not falling interest rates as the economy has slowed.
The average bear market lasts 1.2 years and that is about where we are now. Continue to look beyond the current environment, and as the historical statistics outlined above show, we believe better times for the market are near.
We will put out additional commentary as needed, and as always, we thank you for your trust and confidence.
Royal Fund Management
Related Posts
Articles
5 Points to Maximize Your 401(k)
Gabe Fransen | July 22, 2024 According to InvestmentNews, for the first time, more than 70 million private-sector employees in the US had access to a 401(k) in 2023. This is up 6.35% from the Read more…
Articles
July 15th, 2024 Market Commentary – Royal Fund Management
Articles
Financial Planning: Key Considerations for Different Ages
Gabe Fransen | May 16, 2024 At Strategic Financial Group we feel that retirement planning is a crucial part of your financial journey, and the earlier you start, it is likely you’ll be better prepared Read more…